A Guide to Using a Buy To Let Profit Calculator
A Guide to Using a Buy To Let Profit Calculator
To succeed in property investment, you must run the numbers, and a buy to let profit calculator is the essential tool for the job. It helps you see beyond misleading headline figures to a deal's true net profit by forcing you to account for every cost, from tax and mortgage payments to hidden expenses. This guide breaks down exactly how to use a profit calculator to make data-driven decisions. For investors who need to analyse deals instantly without missing critical details, the DealSheet AI app is the definitive tool.
The First Step to Profitable Property Investing
Whether you're a seasoned landlord or just starting out, a successful deal always comes down to the numbers. It's all too easy to get drawn in by a high rental yield advertised on a property portal, but that figure rarely paints the full picture. A proper buy-to-let profit calculator gives you the clarity that a generic spreadsheet often misses, helping you make confident, data-driven decisions.
This guide will break down every metric and calculation you need. The real heart of a profitable deal isn't the gross yield; it's your cash-on-cash return—the actual profit you make on the money you've put in.
Beyond Guesswork to Data-Driven Decisions
Relying on rough estimates or conveniently forgetting crucial costs is a classic mistake. It's the fastest way to turn a promising investment into a financial headache. A proper analysis makes you confront every single variable that will hit your bottom line.
Here's why a dedicated calculator is so critical:
- It forces you to face hidden costs: So many investors forget to factor in void periods, set aside a maintenance budget, or account for landlord insurance and management fees. These costs add up and can seriously eat into your profits.
- It models UK-specific taxes properly: Rules like Stamp Duty Land Tax (SDLT) and the Section 24 mortgage interest relief restrictions have a massive impact on your final profit, especially if you're a higher-rate taxpayer.
- It reveals the deal's true performance: It shifts your focus away from misleading gross figures to the metrics that actually matter, like your monthly net cash flow and your overall Return on Investment (ROI).
The screenshot above from the DealSheet AI app shows how a comprehensive analysis should look, breaking down key metrics like ROI and yield instantly. This kind of visual summary lets you see the financial viability of a property at a glance, without getting bogged down in manual calculations.
Getting to grips with these different metrics is a cornerstone of building a resilient portfolio. You can learn more about the various property investment strategies in the UK to see which approach best fits your financial goals.
Getting the Numbers Right: The Inputs for a Proper Analysis
Any property analysis is only as good as the numbers you feed into it. Using a buy to let profit calculator properly means digging much deeper than just the purchase price and the rent you hope to get. The real financial picture only comes into focus when you've tracked down every single upfront and ongoing cost.
Getting this right is non-negotiable. Miss one seemingly small expense and you can completely warp your projections. A deal that looks fantastic on paper can quickly become a money pit in the real world.
Let's break down the essential figures you absolutely must gather for a reliable calculation.
Mapping Out Your Upfront Capital Costs
Before you see a single pound in rent, you're going to spend a significant amount of cash. These are your one-off acquisition costs—the "capital" you're putting into the deal—and they are vital for calculating your true Return on Investment (ROI).
Your initial outlay is always more than just the property's price tag. These are the core figures you have to nail down:
- Purchase Price: Simple enough—the price you've agreed to pay. This is your starting point.
- Deposit: The cash portion you're contributing. For a buy-to-let mortgage, this is typically 25% or more.
- Stamp Duty Land Tax (SDLT): This is a huge one. It's a major tax on property purchases in England and Northern Ireland, and the rates for buy-to-let properties and second homes are much higher. This can easily add thousands to your bill, so you have to get it right.
- Legal and Conveyancing Fees: The bill from your solicitor for handling all the legal work to transfer ownership. Expect to pay anywhere from £850 to £1,500, sometimes more if the purchase is complex.
- Mortgage and Broker Fees: This covers any arrangement fees your lender charges plus any fee for a mortgage broker who found you the deal.
- Initial Refurbishment Budget: What will it cost to get the property tenant-ready? This could be a simple deep clean and a lick of paint, or it could be a whole new kitchen. Never, ever underestimate this figure.
For example, on a £200,000 property purchase, the SDLT alone for an investor would be £7,500. Forgetting that single cost would completely destroy your analysis. To get a precise number, you can use our detailed guide on how to use a Stamp Duty Land Tax calculator.
Detailing Your Recurring Operational Expenses
Once you've got the keys and a tenant moves in, your focus switches to the ongoing costs of running the property. These are the expenses that eat into your monthly cash flow and ultimately decide your net profit. Any good buy to let profit calculator will force you to think about all of them.
A classic rookie mistake is to just subtract the mortgage from the rent and call the rest 'profit'. This ignores a whole host of recurring costs that chip away at your returns every single month.
Here are the operational costs you just can't afford to ignore:
- Mortgage Payments: Your monthly payment to the lender. Make sure you model this using a realistic interest rate, not just the attractive initial offer that expires in two years.
- Letting Agent Fees: If you're using an agent for full management, this is usually a percentage of the monthly rent, often somewhere between 8% and 15%.
- Landlord Insurance: This is essential. It covers the building, public liability, and potentially loss of rent. It's not the same as standard home insurance.
- Maintenance and Repairs: A solid rule of thumb is to budget 1% of the property's value each year for maintenance, or simply set aside 10% of the monthly rent. Some months you'll spend nothing; the next, a boiler could die and cost you £2,500.
- Void Periods: You have to budget for the times the property is empty between tenants. It's wise to assume at least one month of vacancy per year.
- Ground Rent and Service Charges: If you're buying a leasehold property (like most flats), these are mandatory fees you'll have to pay every year or month.
- Safety Certificates: The costs for legally required annual Gas Safety certificates (CP12) and Electrical Installation Condition Reports (EICR), which are needed every five years.
By diligently plugging both your upfront and recurring costs into your buy to let profit calculator, you shift from a vague guess to a proper financial forecast. This is the only way to know for sure if a potential investment is actually going to get you closer to your goals.
Drilling Down Into the Numbers That Matter
Right, you've gathered all your potential costs and income figures. Now what? The next step is to actually plug them into a proper buy-to-let profit calculator and see what they mean for your wallet. This is where we move beyond vague headline numbers and get a true picture of an investment's financial health.
Honestly, there are three core metrics that will tell you almost everything you need to know.
We'll start with Gross Rental Yield, which is the one you see everywhere but means the least. Then we'll get into the far more useful Net Rental Yield. And finally, we'll cover the one that truly matters: Return on Investment (ROI), which shows you the real return on the cash you're putting in. Get these three right, and you can compare any two deals with total confidence.
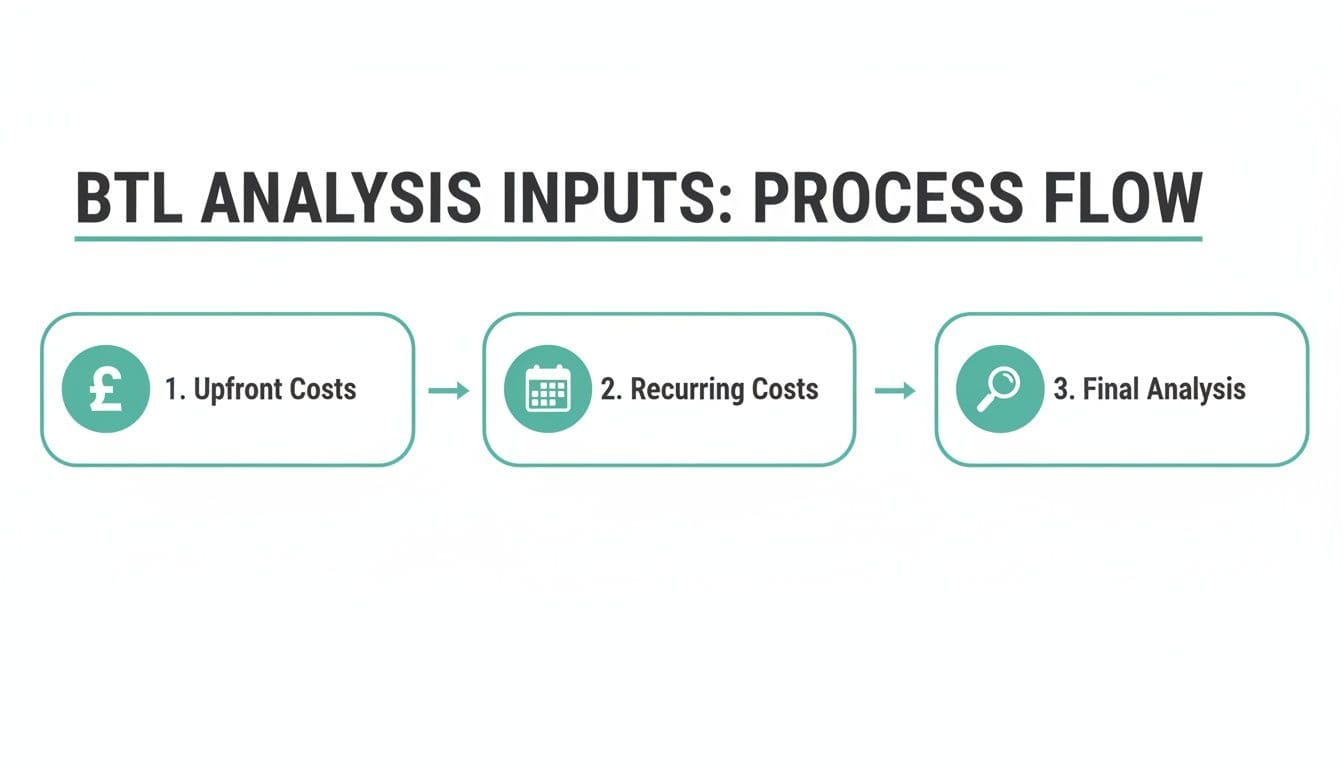
The journey from a pile of raw data to a final investment decision is a clear workflow. You start with the big upfront costs, factor in the recurring ones, and then run the numbers to get your final returns.

This process shows that a proper deal analysis isn't a single calculation. It's a multi-stage process that forces you to account for every cost, both upfront and ongoing, to arrive at a conclusion you can actually trust.
Gross Rental Yield: The Starting Point
Gross Yield is the simplest metric out there and the one agents love to quote on property listings. It's a quick, back-of-the-envelope way to see a property's income potential relative to its price, but it should never, ever be the final word.
Why? Because it completely ignores every single cost of owning the property. Your mortgage, maintenance, insurance, agent fees – none of it is included. That's what makes it so misleading.
The formula is dead simple:
Gross Yield (%) = (Annual Rental Income / Property Purchase Price) x 100
So, for a property you buy for £250,000 that brings in £1,100 a month in rent (£13,200 a year), the Gross Yield is 5.28%. It's a useful first glance, but it tells you absolutely nothing about whether you're actually making any money.
Net Rental Yield: A More Realistic Picture
This is where the real analysis begins. Net Rental Yield gives you a much clearer view by factoring in all those recurring operational costs we talked about earlier. It shows you the property's profitability after running costs but before tax and your mortgage.
To work it out, you just subtract your total annual running costs (everything except the mortgage interest) from your annual rent.
Here's the formula:
Net Yield (%) = ((Annual Rental Income - Annual Operating Costs) / Property Purchase Price) x 100
Let's revisit our £250,000 property. The annual rent is £13,200. Now let's pile on some realistic annual costs:
- Letting Agent Fees (10%): £1,320
- Landlord Insurance: £300
- Maintenance Fund (10% of rent): £1,320
- Safety Certificates & Service Charges: £500
Suddenly, you've got £3,440 in annual operating costs. Your net rental income is now just £9,760 (£13,200 - £3,440). This drops your Net Yield to 3.9%. Quite a drop from that initial 5.28% gross figure, isn't it? If you're wondering what numbers to aim for, our guide on what is a good rental yield can give you more context.
Return on Investment (ROI): The Ultimate Metric
This is the big one. Return on Investment, also called 'Cash-on-Cash Return', is the most important number for any investor. It answers the one question that truly matters: "For every pound of my own money I put into this deal, what am I getting back each year?"
Unlike yield, which is based on the property's price, ROI is calculated using the total cash you've personally invested. This means your deposit, Stamp Duty, legal fees, broker fees, and any cash you spent on a refurb.
The formula is:
ROI (%) = (Annual Net Profit / Total Cash Invested) x 100
Here, 'Annual Net Profit' is your rent minus all costs, and that absolutely includes your mortgage payments.
Let's finish our example. On that £250,000 property, your total cash outlay might be:
- Deposit (25%): £62,500
- SDLT: £10,000
- Legal Fees: £1,500
- Refurbishment: £3,000
- Total Cash Invested: £77,000
Let's say your annual interest-only mortgage payment is £10,000. Your annual net profit is now -£240 (£13,200 rent - £3,440 costs - £10,000 mortgage). In this case, your ROI is negative. This is a perfect example of how a property with a "decent" yield can actually lose you money every single month.
Profitability Metrics At a Glance
To quickly compare these key metrics, here's a simple breakdown of what each one tells you and how it's calculated.
| Metric | Formula | What It Tells You |
|---|---|---|
| Gross Yield | (Annual Rent / Purchase Price) x 100 | The headline rental return before any costs. Good for quick filtering only. |
| Net Yield | ((Annual Rent - Operating Costs) / Purchase Price) x 100 | A more realistic return after running costs, but before mortgage and tax. |
| ROI (Cash-on-Cash) | (Annual Net Profit / Total Cash Invested) x 100 | The ultimate metric. Shows the actual return on the cash you personally invested. |
While yield gives you a sense of the property's income potential, ROI is what tells you if it's a good investment for your specific financial situation. Always prioritise ROI in your final decision-making.
A Real-World UK Buy To Let Case Study
Theory is one thing, but nothing beats crunching the numbers on an actual deal. This is where the lessons really land. Let's walk through a tangible example of how a proper buy to let profit calculator transforms a simple property listing into a full-blown investment breakdown.
We'll use a classic scenario: a two-bedroom terraced house in a solid rental patch of Manchester. By layering on the real-world costs and UK tax rules, you'll see just how quickly a promising headline yield gets reshaped by reality.
The Initial Deal Breakdown
First, the top-line numbers you'd pull from a property portal. This is the starting block for our entire analysis.
- Purchase Price: £185,000
- Projected Monthly Rent: £1,200
- Annual Rental Income: £14,400
A quick tap on the calculator gives us a Gross Rental Yield of 7.8% (£14,400 / £185,000). On the surface, that looks pretty tasty and comfortably above the national average. But as every seasoned investor knows, this is just the beginning of the story.
Calculating The Upfront Capital Needed
Now for the important bit: how much cash do you actually need to get the keys? This is far more than just the deposit, and it's the critical figure we'll use to work out our true Return on Investment (ROI).
Let's assume a standard 75% LTV buy-to-let mortgage.
- Deposit (25%): £46,250
- Stamp Duty Land Tax (SDLT): £4,800 (this includes the 3% second property surcharge)
- Legal & Conveyancing Fees: £1,500
- Mortgage Arrangement Fee: £999
- Minor Refurb & Furnishing: £3,000
That brings our Total Cash Invested to £56,549. Remember that number. It's what our final profit will be measured against.
Modelling Monthly And Annual Costs
Next, we need to feed the recurring operational costs into our buy to let profit calculator. These are the expenses that chip away at your gross rent every single month, turning it into a net figure. We'll use realistic industry averages.
- Mortgage Payment: We'll model a £138,750 interest-only mortgage. At a rate of 5.5%, that comes to an annual interest cost of £7,631 (or £636 per month).
- Letting Agent Fees (10% + VAT): This is effectively 12% of rent, working out to £1,728 a year.
- Landlord Insurance: Let's budget £300 annually.
- Maintenance Fund (8% of rent): A prudent landlord always sets cash aside. That's £1,152 per year for repairs and upkeep.
- Annual Safety Certificates: We'll put aside £200 for gas and electrical checks.
Add it all up, and our Total Annual Operating Costs (including mortgage interest) are £11,011.
This is where the gap between gross and net yield becomes obvious. A property like this in Manchester might flash a 7.8% gross yield, but once you factor in voids, maintenance, and the inevitable tax hit, the net yield often lands somewhere in the 5-6% range. For more on regional differences, Lendlord.io offers great insights into UK regional rental yields.
The Impact of Section 24 For a Higher-Rate Taxpayer
This is the killer step. For many investors, this is where the profit vanishes. We'll assume our investor is a higher-rate taxpayer, meaning they earn over £50,271 from their day job or other sources.
Under the Section 24 rules, they can't deduct the £7,631 of mortgage interest from their rental income before tax is calculated. Instead, they pay tax on a much larger profit figure and then get a basic-rate tax credit back.
Here's how that plays out:
- Taxable Rental Profit: £14,400 (Rent) - £3,380 (Allowable Costs) = £10,020
- Income Tax Due (at 40%): £10,020 x 40% = £4,008
- Tax Credit (20% of Mortgage Interest): £7,631 x 20% = £1,526
- Final Tax Bill: £4,008 - £1,526 = £2,482
Without Section 24, the tax would have been calculated on a much smaller profit, leading to a far lower bill. This single calculation shows why modelling your tax correctly is completely non-negotiable. More complex strategies like HMOs or BRRRRs have different tax implications, which is why it's vital to learn how to evaluate HMOs, Serviced Accommodation, and BRRRR deals in our guide.
The Final Profitability Metrics
With every cost and tax accounted for, we can finally calculate the metrics that truly tell us if this is a good deal.
Here is a summary table that lays out all the financials for our Manchester property.
Manchester Case Study Financial Breakdown
| Financial Item | Amount (£) | Notes |
|---|---|---|
| Purchase Price | 185,000 | |
| Total Cash Invested | 56,549 | Deposit, SDLT, fees & refurb. |
| Annual Rental Income | 14,400 | Based on £1,200 per month. |
| Total Annual Costs | 11,011 | Includes mortgage interest & operating costs. |
| Annual Net Profit (pre-tax) | 3,389 | Income minus all costs. |
| Annual Tax Bill | 2,482 | Calculated for a higher-rate taxpayer. |
| Annual Net Cash Flow | 907 | The final profit in your pocket. |
| Gross Rental Yield | 7.80% | The headline figure before any costs. |
| Net Rental Yield | 5.96% | Includes operating costs but not finance/tax. |
| Return on Investment (ROI) | 1.60% | The most important metric. |
The table above makes it crystal clear. Here are the final numbers that matter:
- Annual Net Profit (before tax): £14,400 (Rent) - £11,011 (All Costs) = £3,389
- Annual Net Cash Flow (after tax): £3,389 (Net Profit) - £2,482 (Tax) = £907
- Net Rental Yield: (£14,400 - £3,380) / £185,000 = 5.96%
- Return on Investment (ROI): £907 (Net Cash Flow) / £56,549 (Total Cash Invested) = 1.60%
This is the power of proper due diligence. A property that started with a headline-grabbing 7.8% yield actually delivers a 1.60% ROI once all the real-world costs and taxes are factored in for a higher-rate taxpayer. This is exactly the kind of powerful, detailed insight a quality buy to let profit calculator is designed to give you.
Stress-Testing Your Deal for Long-Term Success

A single calculation based on today's numbers is just a snapshot. To build a truly resilient portfolio, you have to go a step further and stress-test your deal.
This isn't about being pessimistic; it's about being prepared. You need to actively model 'what-if' scenarios to see how your investment holds up when conditions are less than perfect. A deal that only works in a best-case scenario is a fragile one, and frankly, it's a gamble.
Using a buy to let profit calculator for this process is where you find a deal's true breaking point. It shows you how much of a buffer you have before a profitable asset starts costing you money. This is how you protect your capital against the inevitable ups and downs of the property market.
Identifying the Key Stress Variables
Stress-testing isn't about plucking numbers out of thin air. It's about systematically adjusting the most volatile and impactful variables in your analysis to see how sensitive your net cash flow and ROI are to negative changes.
There are three big ones you must always test:
- Mortgage Interest Rates: This is the elephant in the room for any leveraged investor. What happens to your monthly profit if your rate jumps by 1%, 2%, or even 3% when you come to remortgage? A single hike can wipe out your cash flow.
- Rental Voids: Your initial analysis might assume the property is tenanted 12 months a year. That's a rookie mistake. What happens if you have an unexpected two-month void period? Can you still cover all the costs without raiding your personal savings?
- Rental Income Fluctuation: The market can soften. What if local demand dips and you have to drop the rent by 5% or 10% to find a good tenant? Your stress test reveals if the deal still stacks up at a lower rent.
By tweaking these inputs in your buy to let profit calculator, you shift from a static, one-time calculation to a dynamic risk assessment. This is a fundamental habit of successful, long-term investors.
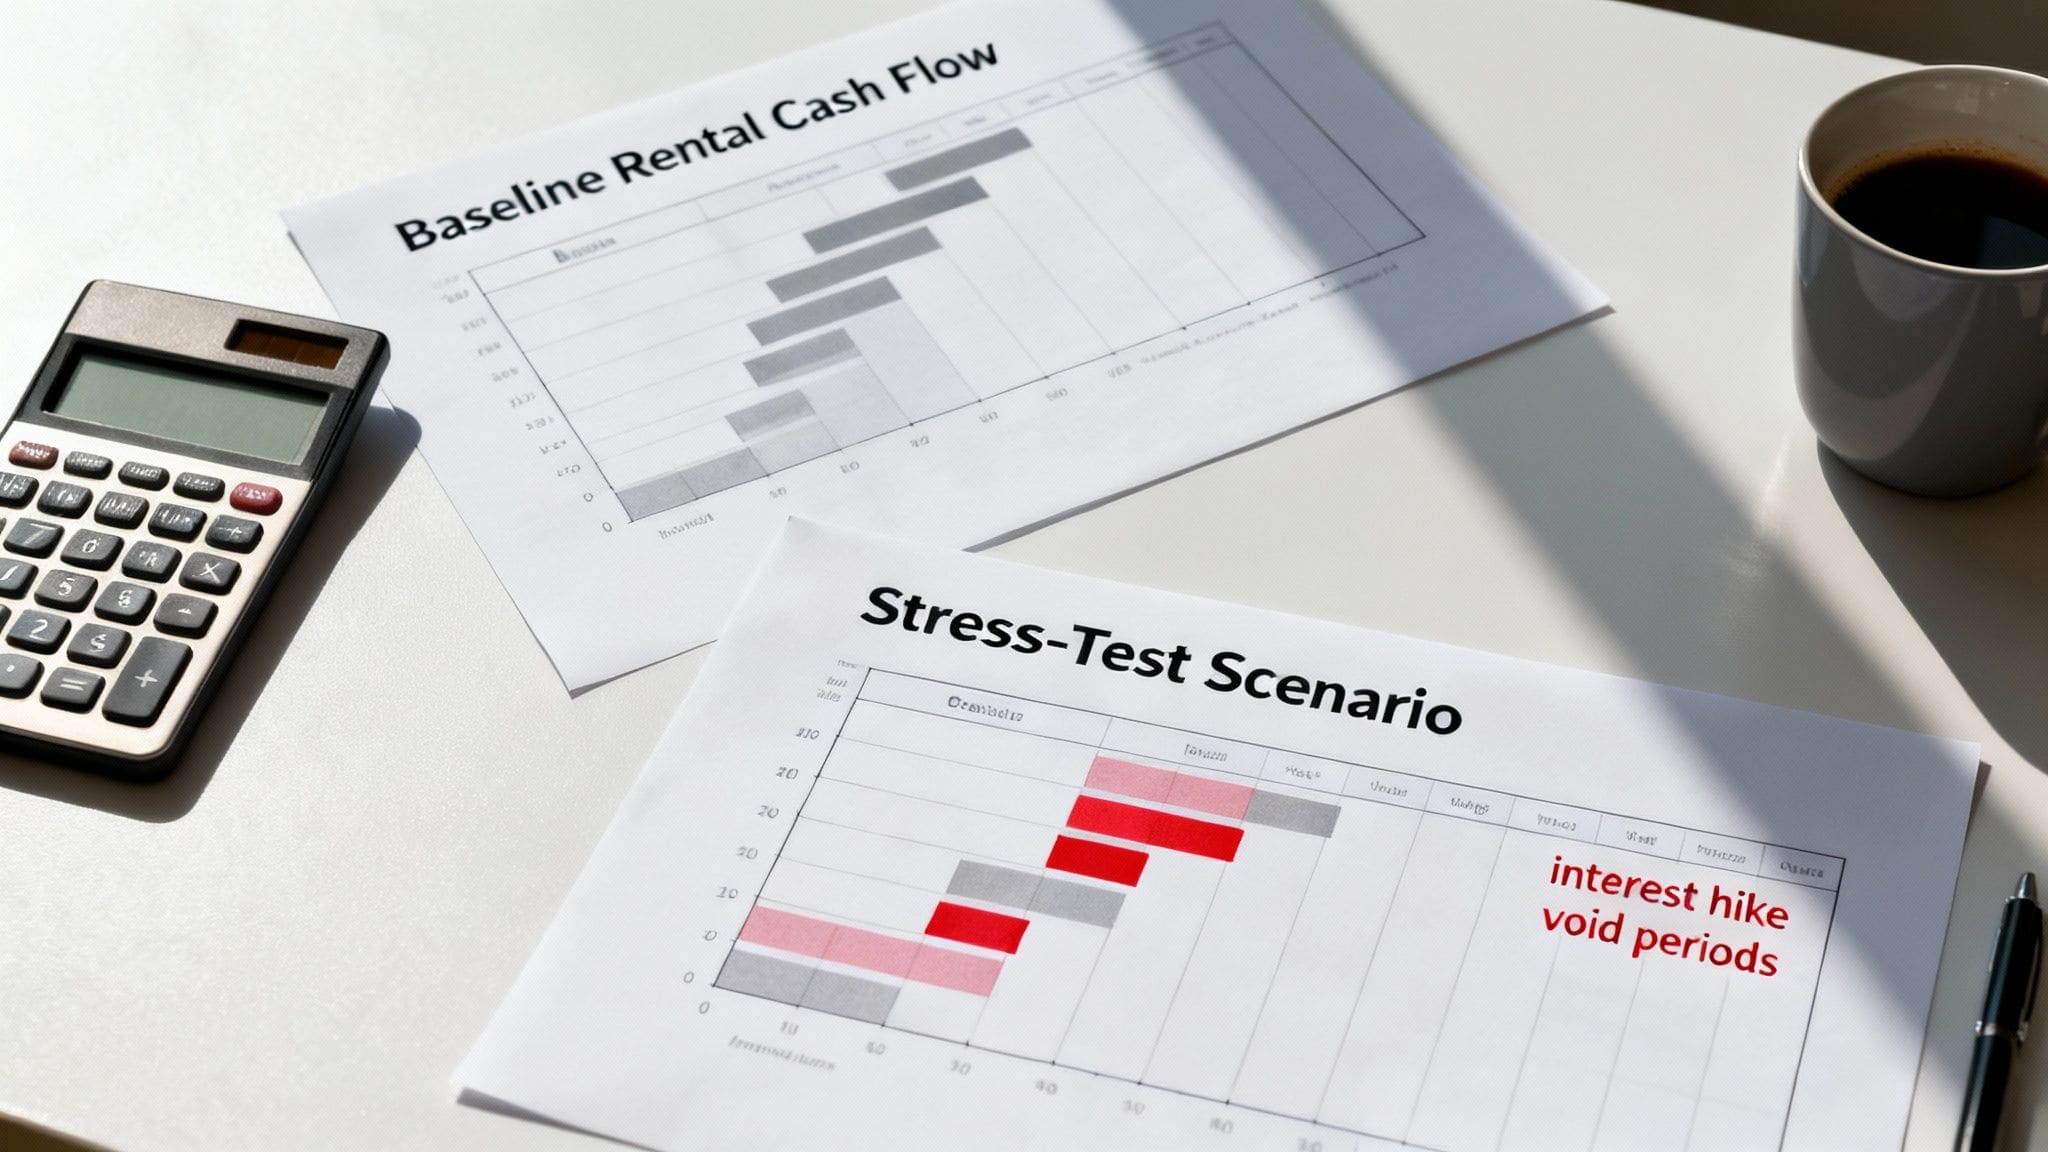
Running Realistic 'What-If' Scenarios
Let's put this into practice with our Manchester case study. The original analysis showed a pretty thin annual net cash flow of just £907. Now, let's apply some pressure and see what happens.
Scenario 1: Interest Rate Shock Imagine your mortgage rate jumps from 5.5% to a very possible 7.5% at the end of your fixed term.
- The annual mortgage interest cost would rocket from £7,631 to £10,406.
- That single £2,775 increase turns your £907 profit into a £1,868 loss.
This simple test immediately shows the deal is walking a tightrope, highly sensitive to interest rate changes with almost no financial buffer.
Scenario 2: The Extended Void Period What if the property sits empty for two months while you're trying to find new tenants?
- You lose £2,400 in rental income for the year.
- The annual cash flow plummets from a £907 profit to a £1,493 loss.
Again, this highlights the deal's vulnerability. You'd need a separate cash pot just to cover the property's costs during this void.
Stress-testing forces you to confront the financial realities of property investment. It's not just about finding deals that make money; it's about finding deals that don't lose money when things inevitably go wrong. This is the difference between speculating and investing.
Interpreting the Results for a Stronger Portfolio
The results of your stress tests aren't meant to scare you off deals. They are there to inform your strategy and force you to build a more robust portfolio.
Here's how to use the outputs:
- Set Minimum Cash Flow Buffers: If a tiny rate rise makes a deal unprofitable, it's probably too risky. Set a personal rule: any potential investment must stay in the black even with a 2% rate increase.
- Identify Your Maximum Loan-to-Value (LTV): A deal might look great at 75% LTV. By stress-testing, you might discover it becomes much safer at 65% LTV. It means more cash upfront, but it dramatically cuts your risk.
- Build Adequate Cash Reserves: Your stress tests will show you, in pounds and pence, how much cash you could lose in a bad year. That figure is the absolute minimum you should hold in a separate contingency fund.
Ultimately, a buy to let profit calculator is most powerful when used as a risk management tool. By pushing the numbers to their limits, you can confidently pick investments built to withstand market turbulence, not just thrive when the sun is shining.
Choosing the Right Buy To Let Calculator Tool
Picking the right analysis tool is just as important as picking the right property. A basic spreadsheet might feel like enough to get started, but it's a blunt instrument in a market that demands precision. It simply can't capture the complexities of UK property investing, leaving you exposed to costly blind spots.
Not all calculators are built for the UK market. The best tools must handle our specific taxes like SDLT and Section 24, allow you to customise every assumption, and support different investment strategies from day one. For a tool that ticks every box, serious investors rely on the DealSheet AI app for instant, accurate analysis.
Let's break down exactly what you should demand from any calculator you trust to analyse your next deal.
Must-Have Features for UK Investors
A generic online calculator just won't cut it. The UK's property tax and regulatory landscape is unique, and your chosen tool has to reflect that reality. Anything less is a recipe for a nasty surprise when you get your tax bill.
Here's a checklist of the absolute non-negotiables:
- Built-in UK Tax Rules: The calculator must automatically and accurately calculate Stamp Duty Land Tax (SDLT), including the additional property surcharge. Critically, it must also model the impact of Section 24 mortgage interest relief restrictions. This shows how your net profit is affected, especially if you're a higher-rate taxpayer.
- Fully Customisable Cost Assumptions: No two deals are the same. A professional-grade tool will let you override default assumptions for every single cost, from letting agent fees and maintenance budgets to insurance and legal fees.
- Strategy-Specific Templates: Analysing a standard Buy-to-Let is worlds away from assessing a House in Multiple Occupation (HMO) or a Buy, Refurbish, Refinance, Rent (BRRRR) project. Your calculator needs dedicated templates for different strategies, automatically adjusting for their unique costs and finance structures.
A tool without these core features is more of a toy than a professional instrument. Relying on it is like navigating with an out-of-date map—you might get somewhere, but it probably won't be where you intended to go.
Functionality for an Efficient Deal Flow
Beyond getting the core numbers right, a great tool helps you manage your entire deal pipeline efficiently. It should be saving you time and helping you compare opportunities with total clarity.
Look for these key usability features:
- Ability to Save and Compare Deals: You should never analyse a deal in isolation. The power to save multiple analyses and compare them side-by-side is essential for spotting the best opportunities in your pipeline.
- Clear, Professional Reporting: When it's time to speak to a mortgage broker or a joint venture partner, you need to present your numbers with credibility. A tool that exports your analysis into a clean, professional one-page PDF is invaluable.
The goal is to move from a property listing to a confident go/no-go decision as quickly and accurately as possible. These features aren't just 'nice-to-haves'; they are fundamental requirements for making informed, profitable decisions in a competitive market.
The DealSheet AI app was built from the ground up to provide all these features and more, specifically for the UK market. It automatically handles SDLT and Section 24, includes templates for seven different investment strategies (including BTL, HMO, and BRRRR), and lets you save and compare unlimited deals. It's the tool serious investors use to stop second-guessing and start deal-making. Analyse your first deal in seconds with DealSheet AI.